> ## Documentation Index
> Fetch the complete documentation index at: https://docs.rightnowai.co/llms.txt
> Use this file to discover all available pages before exploring further.
# Static Analysis
> See CUDA optimization tips without running code.
# Static Analysis
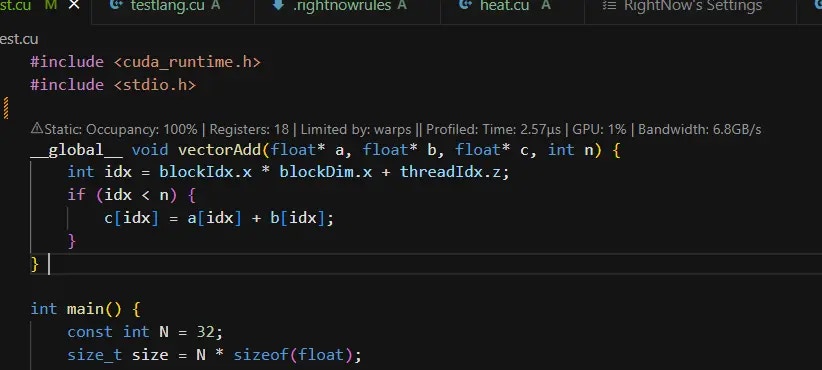
Real-time CUDA code analysis shows performance metrics directly above your kernels.
## What It Does
CodeLens automatically analyzes your CUDA code and shows:
* Execution time and GPU efficiency
* Register and shared memory usage
* Occupancy calculations
* Performance bottlenecks
## How to Use
Open a .cu file and write your kernel.
Press Ctrl+S. CodeLens updates automatically.
Look above your kernel for two lines of performance data.
If you see warnings, the CodeLens tells you what's limiting performance.
## What You See
 ### CodeLens Display
Two lines appear above each kernel:
**Line 1 - Runtime Performance:**
```
✅ addVectors: 18.5ms • SM:95.3% • Occ:87.5% • Mem:245.8GB/s
```
**Line 2 - Static Analysis:**
```
⚠️ Static: Registers: 64 • Shared: 8KB • Max occupancy: 50% (reg-limited)
```
### Performance Indicators
* ✅ **Green**: Excellent performance
* ⚠️ **Yellow**: Can be optimized
* ❌ **Red**: Performance issue needs attention
## Understanding the Metrics
### Runtime Metrics
* **Time**: How fast your kernel runs (ms)
* **SM**: GPU utilization percentage
* **Occ**: Thread occupancy percentage
* **Mem**: Memory bandwidth (GB/s)
### Static Metrics
* **Registers**: Per-thread register count
* **Shared**: Shared memory per block
* **Limiting factor**: What's preventing better occupancy
## Common Issues and Fixes
### "reg-limited"
Too many registers per thread:
* Simplify calculations
* Use shared memory for arrays
* Reduce local variables
### "smem-limited"
Too much shared memory:
* Reduce shared array sizes
* Use dynamic shared memory
* Process data in smaller tiles
### Register Spilling
CodeLens shows spill warnings:
* Reduce register pressure
* Split complex kernels
* Use compiler flags to limit registers
## Advanced Build Settings
Click "Advanced Build Settings" in editor toolbar to:
* ✅ Generate .ptx files
* ✅ Generate .cubin files
* ✅ Run after build
These options help with deeper optimization analysis.
## Tips
**Best Practices**
* Keep occupancy above 50%
* Fix red warnings first
* Save file to update metrics
* Use build settings for PTX analysis
**Remember**
CodeLens shows estimates. Always benchmark to verify actual performance.
## Screenshots Needed
1. **CodeLens two-line display** - Both performance lines above kernel
2. **Static analysis warnings** - Yellow/red indicators with messages
3. **Advanced Build Settings** - Checkbox panel with PTX/CUBIN options
## Next Steps
* [Benchmarking](/benchmarking) - Measure actual performance
* [GPU Emulation](/gpu-emulation) - Test on different GPUs
* [Core Features](/core-features) - AI optimization help
### CodeLens Display
Two lines appear above each kernel:
**Line 1 - Runtime Performance:**
```
✅ addVectors: 18.5ms • SM:95.3% • Occ:87.5% • Mem:245.8GB/s
```
**Line 2 - Static Analysis:**
```
⚠️ Static: Registers: 64 • Shared: 8KB • Max occupancy: 50% (reg-limited)
```
### Performance Indicators
* ✅ **Green**: Excellent performance
* ⚠️ **Yellow**: Can be optimized
* ❌ **Red**: Performance issue needs attention
## Understanding the Metrics
### Runtime Metrics
* **Time**: How fast your kernel runs (ms)
* **SM**: GPU utilization percentage
* **Occ**: Thread occupancy percentage
* **Mem**: Memory bandwidth (GB/s)
### Static Metrics
* **Registers**: Per-thread register count
* **Shared**: Shared memory per block
* **Limiting factor**: What's preventing better occupancy
## Common Issues and Fixes
### "reg-limited"
Too many registers per thread:
* Simplify calculations
* Use shared memory for arrays
* Reduce local variables
### "smem-limited"
Too much shared memory:
* Reduce shared array sizes
* Use dynamic shared memory
* Process data in smaller tiles
### Register Spilling
CodeLens shows spill warnings:
* Reduce register pressure
* Split complex kernels
* Use compiler flags to limit registers
## Advanced Build Settings
Click "Advanced Build Settings" in editor toolbar to:
* ✅ Generate .ptx files
* ✅ Generate .cubin files
* ✅ Run after build
These options help with deeper optimization analysis.
## Tips
**Best Practices**
* Keep occupancy above 50%
* Fix red warnings first
* Save file to update metrics
* Use build settings for PTX analysis
**Remember**
CodeLens shows estimates. Always benchmark to verify actual performance.
## Screenshots Needed
1. **CodeLens two-line display** - Both performance lines above kernel
2. **Static analysis warnings** - Yellow/red indicators with messages
3. **Advanced Build Settings** - Checkbox panel with PTX/CUBIN options
## Next Steps
* [Benchmarking](/benchmarking) - Measure actual performance
* [GPU Emulation](/gpu-emulation) - Test on different GPUs
* [Core Features](/core-features) - AI optimization help